
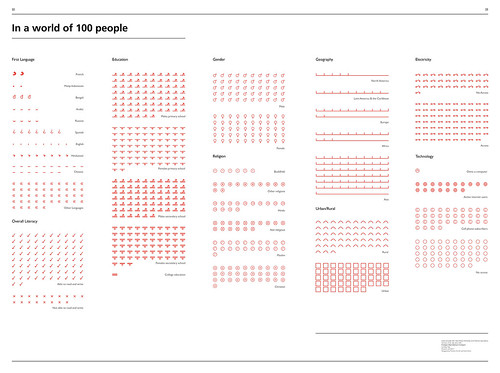
We were given a type brief in which we had to represent a set of
statistics typographically, not like the infographic pictures that we
seem to be swamped with everywhere. I worked on this with Thom Farrall,
and we found it quite a challenge to come up with a decent way of
representing the stats. We are quite pleased with the result, though it
is still not finished - the layout needs to be a bit more interesting!
No comments:
Post a Comment